This page walks through one trading day of One Leg Multi on XAUUSD (gold) with two fast feeds: the set that was used, one Sell trade traced tick by tick, the results of two live sessions and how a backtest of the same quotes compares with live trading. Use it as a worked example of how the settings behave, not as ready-made levels: the right values depend on your broker, its spread and its execution. Every setting is described in the One Leg Multi settings reference.
Providers and set used in this example
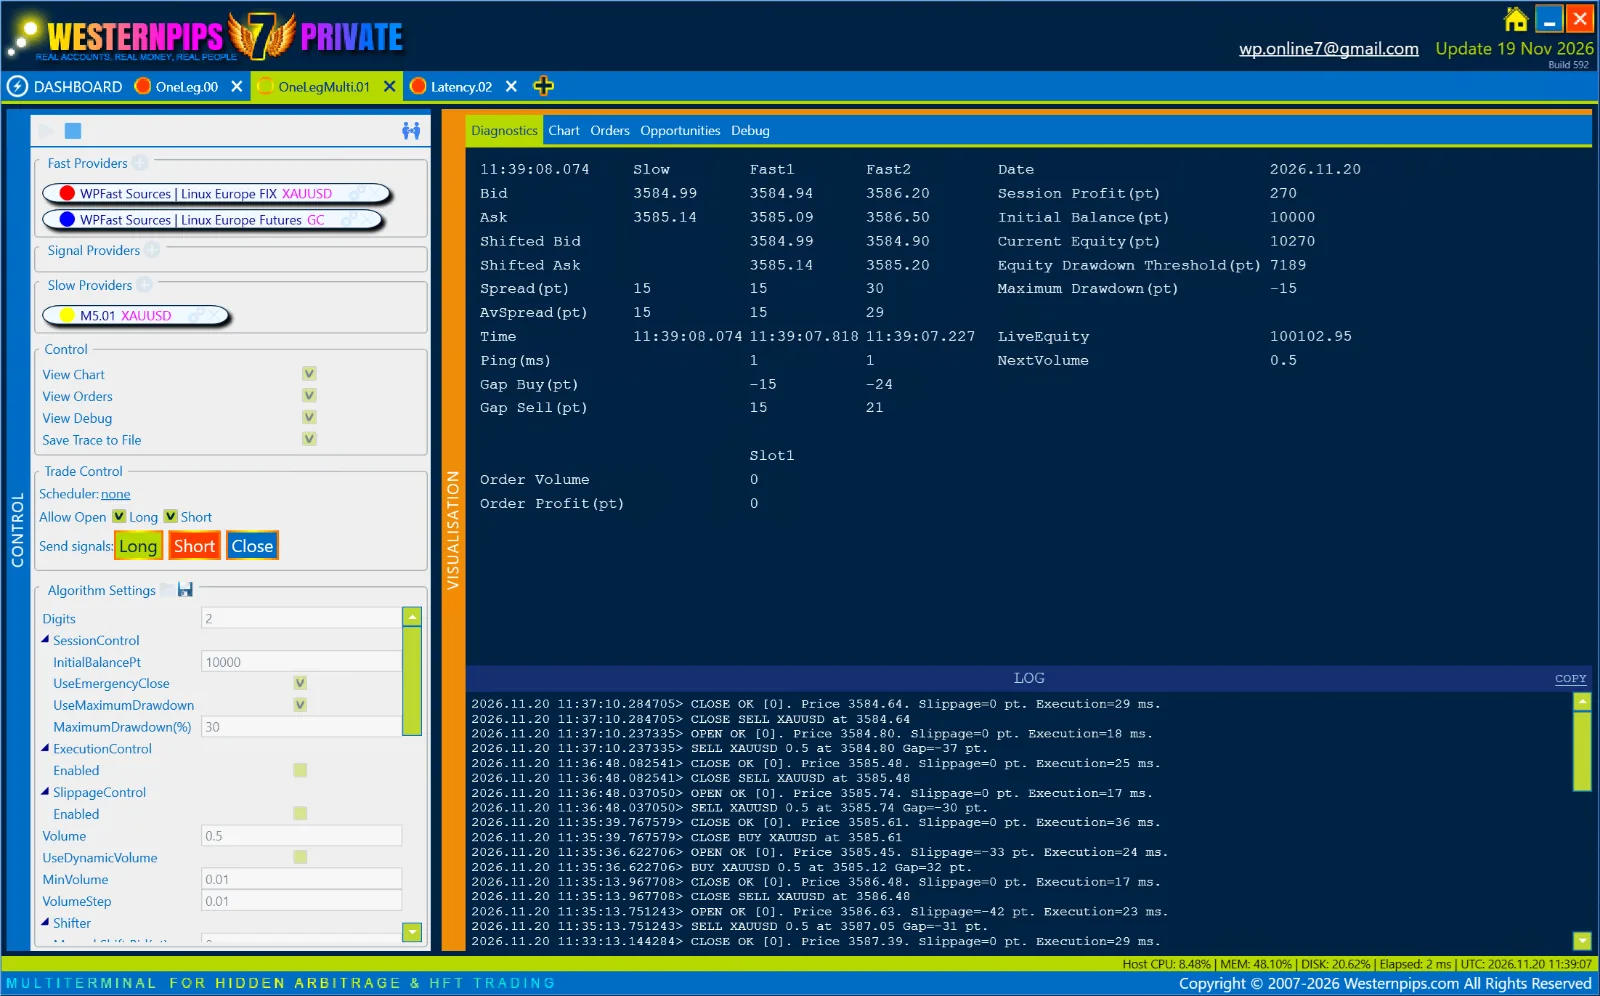
- Fast provider 1: WPFast Sources | Linux Europe FIX, symbol XAUUSD.
- Fast provider 2: WPFast Sources | Linux Europe Futures, symbol GC (gold futures).
- Signal provider: none, so the gap is measured on the trading account.
- Slow provider: an MT5 broker account, symbol XAUUSD, spread 15 points during the session.
| Block | Settings in this set |
|---|---|
| General and volume | Digits 2 (1 point = 0.01), Volume 0.5, UseDynamicVolume off |
| SessionControl | InitialBalancePt 10000, UseEmergencyClose on, UseMaximumDrawdown on, MaximumDrawdown 30% |
| Shifter | Use Auto Shift on, PeriodType Both, PriceMode Median, 100 ticks, 30000 ms, manual shifts 0 |
| SpreadAveraging and filters | Both, 10 ticks, 1000 ms; all spread filters off |
| Entry | Min Open Gap 30 points |
| Exits | TakeProfitMode FromEntry, TakeProfit 15; StopLossMode FromSignal, StopLoss 50; Close Gap off; trailing off |
You can download the example set (.preset) and load it with the folder icon in the Algorithm Settings header to study it.
Why AutoShift matters with a futures feed
Gold futures trade at a premium to spot gold, so without alignment the GC feed would always look far above the broker. The Diagnostics panel at 11:39:08 UTC shows how AutoShift handles it:
| Value | Broker (Slow) | Fast 1 (XAUUSD FIX) | Fast 2 (GC futures) |
|---|---|---|---|
| Bid / Ask | 3584.99 / 3585.14 | 3584.94 / 3585.09 | 3586.20 / 3586.50 |
| Shifted Bid / Ask | — | 3584.99 / 3585.14 | 3584.90 / 3585.20 |
| Spread (pt) | 15 | 15 | 30 |
| Gap Buy / Gap Sell (pt) | — | −15 / 15 | −24 / 21 |
AutoShift moved the GC prices down by about 130 points, so both feeds are compared with the broker on the same level. Check the arithmetic: Gap Buy of Fast 1 = 3584.99 − 3585.14 = −0.15 = −15 points; Gap Sell of Fast 2 = 3585.20 − 3584.99 = 0.21 = 21 points. With the market quiet, both gaps sit near the broker’s spread and far from Min Open Gap 30.
Worked example: one XAUUSD Sell trade, step by step
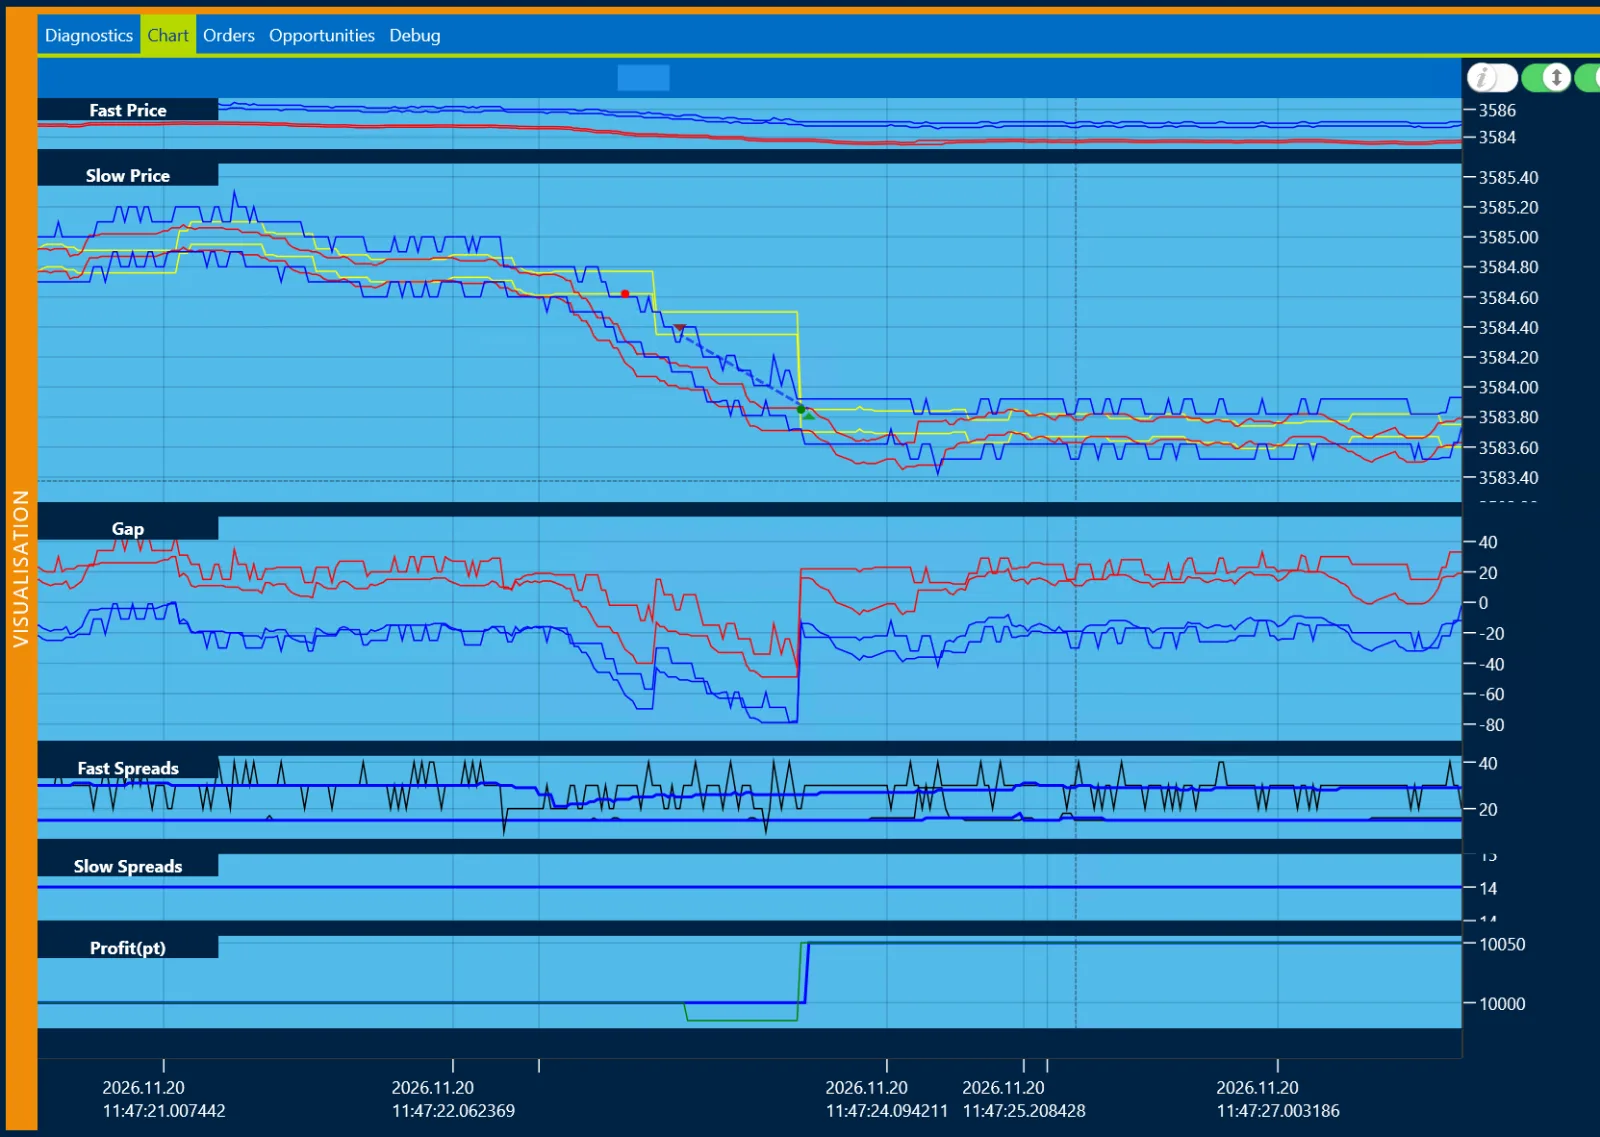
- The fast feeds move first. Around 11:47:23 UTC both fast feeds fall by more than a dollar while the broker’s price stays at its old level. Gap Sell falls far below zero.
- The Sell signal fires. When Gap Sell of a fast feed reaches −31 points, below −Min Open Gap 30, One Leg Multi sends a Sell of 0.5 lot at the broker’s Bid 3584.62.
- The order is filled with slippage. The broker fills at 3584.35 in 36 ms, 27 points worse than the signal price (Slippage=−27 pt).
- Exit levels are set. TakeProfitMode FromEntry places the take profit 15 points below the fill: 3584.20. StopLossMode FromSignal places the stop 50 points above the signal price: 3585.12.
- The broker catches up in one jump. The broker’s Ask drops straight to 3583.85, already past the take profit, and the position is closed there in 25 ms without slippage.
- The result. 3584.35 − 3583.85 = 0.50 = 50 points on 0.5 lot, although TakeProfit was only 15: the take profit is a trigger, and the close happens at the first broker price that reaches it.
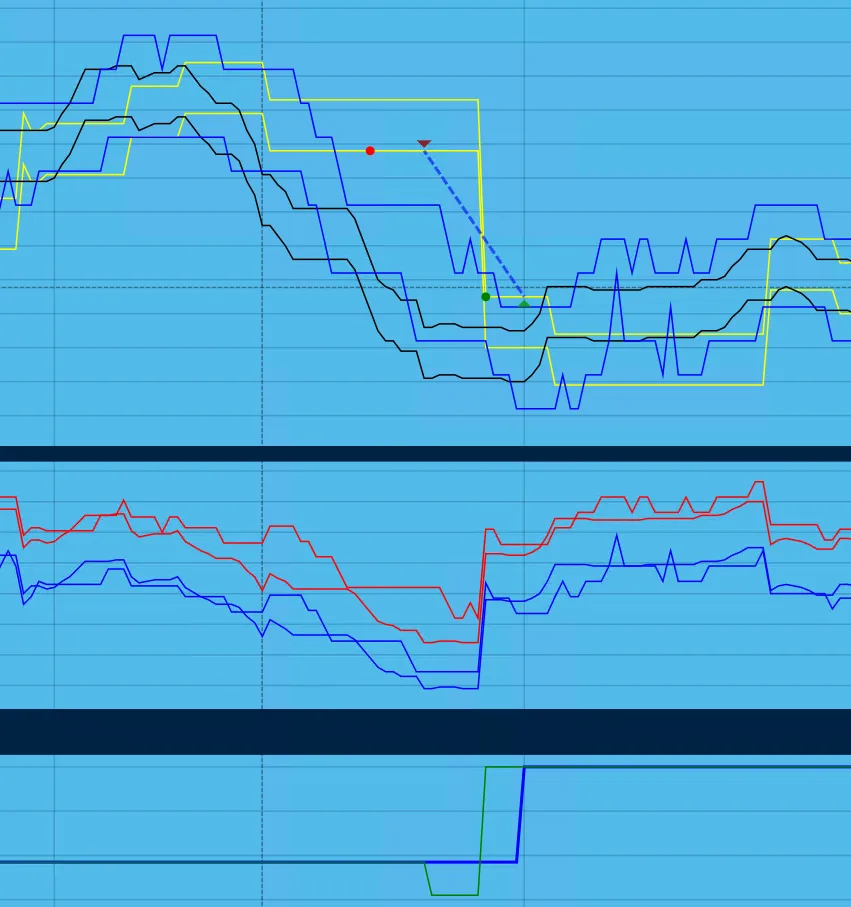
| Log line | What it means |
|---|---|
SELL XAUUSD 0.5 at 3584.62 Gap=-31 pt. |
Signal: Gap Sell passed −30; Sell sent at the broker’s Bid. |
OPEN OK [0]. Price 3584.35. Slippage=-27 pt. Execution=36 ms. |
Filled 27 points worse than requested. |
CLOSE SELL XAUUSD at 3583.85 |
The take profit condition is met: broker Ask ≤ 3584.20. |
CLOSE OK [0]. Price 3583.85. Slippage=0 pt. Execution=25 ms. |
Closed at the requested price: +50 points. |
First live session: 9 trades in 13 minutes
Between 11:25 and 11:37 UTC the strategy made nine trades. The Orders tab and the terminal show the same trades; the terminal times are two hours later because this broker’s server runs at UTC+2.
| Time (UTC) | Side | Signal | Fill | Slippage (pt) | Close | Result (pt) |
|---|---|---|---|---|---|---|
| 11:25:02 | Buy | 3588.72 | 3588.74 | −2 | 3589.20 | +46 |
| 11:30:02 | Sell | 3590.19 | 3590.19 | 0 | 3589.84 | +35 |
| 11:31:11 | Sell | 3589.63 | 3589.63 | 0 | 3589.19 | +44 |
| 11:33:07 | Buy | 3585.98 | 3586.36 | −38 | 3586.82 | +46 |
| 11:33:13 | Sell | 3587.65 | 3587.65 | 0 | 3587.39 | +26 |
| 11:35:13 | Sell | 3587.05 | 3586.63 | −42 | 3586.48 | +15 |
| 11:35:36 | Buy | 3585.12 | 3585.45 | −33 | 3585.61 | +16 |
| 11:36:48 | Sell | 3585.74 | 3585.74 | 0 | 3585.48 | +26 |
| 11:37:10 | Sell | 3584.80 | 3584.80 | 0 | 3584.64 | +16 |
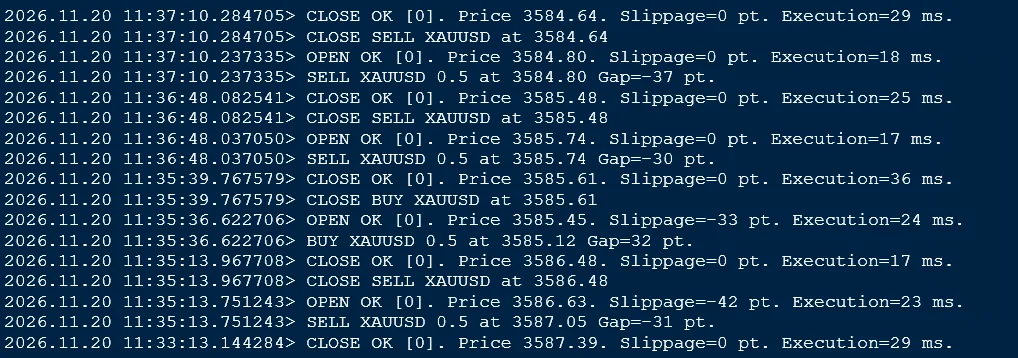
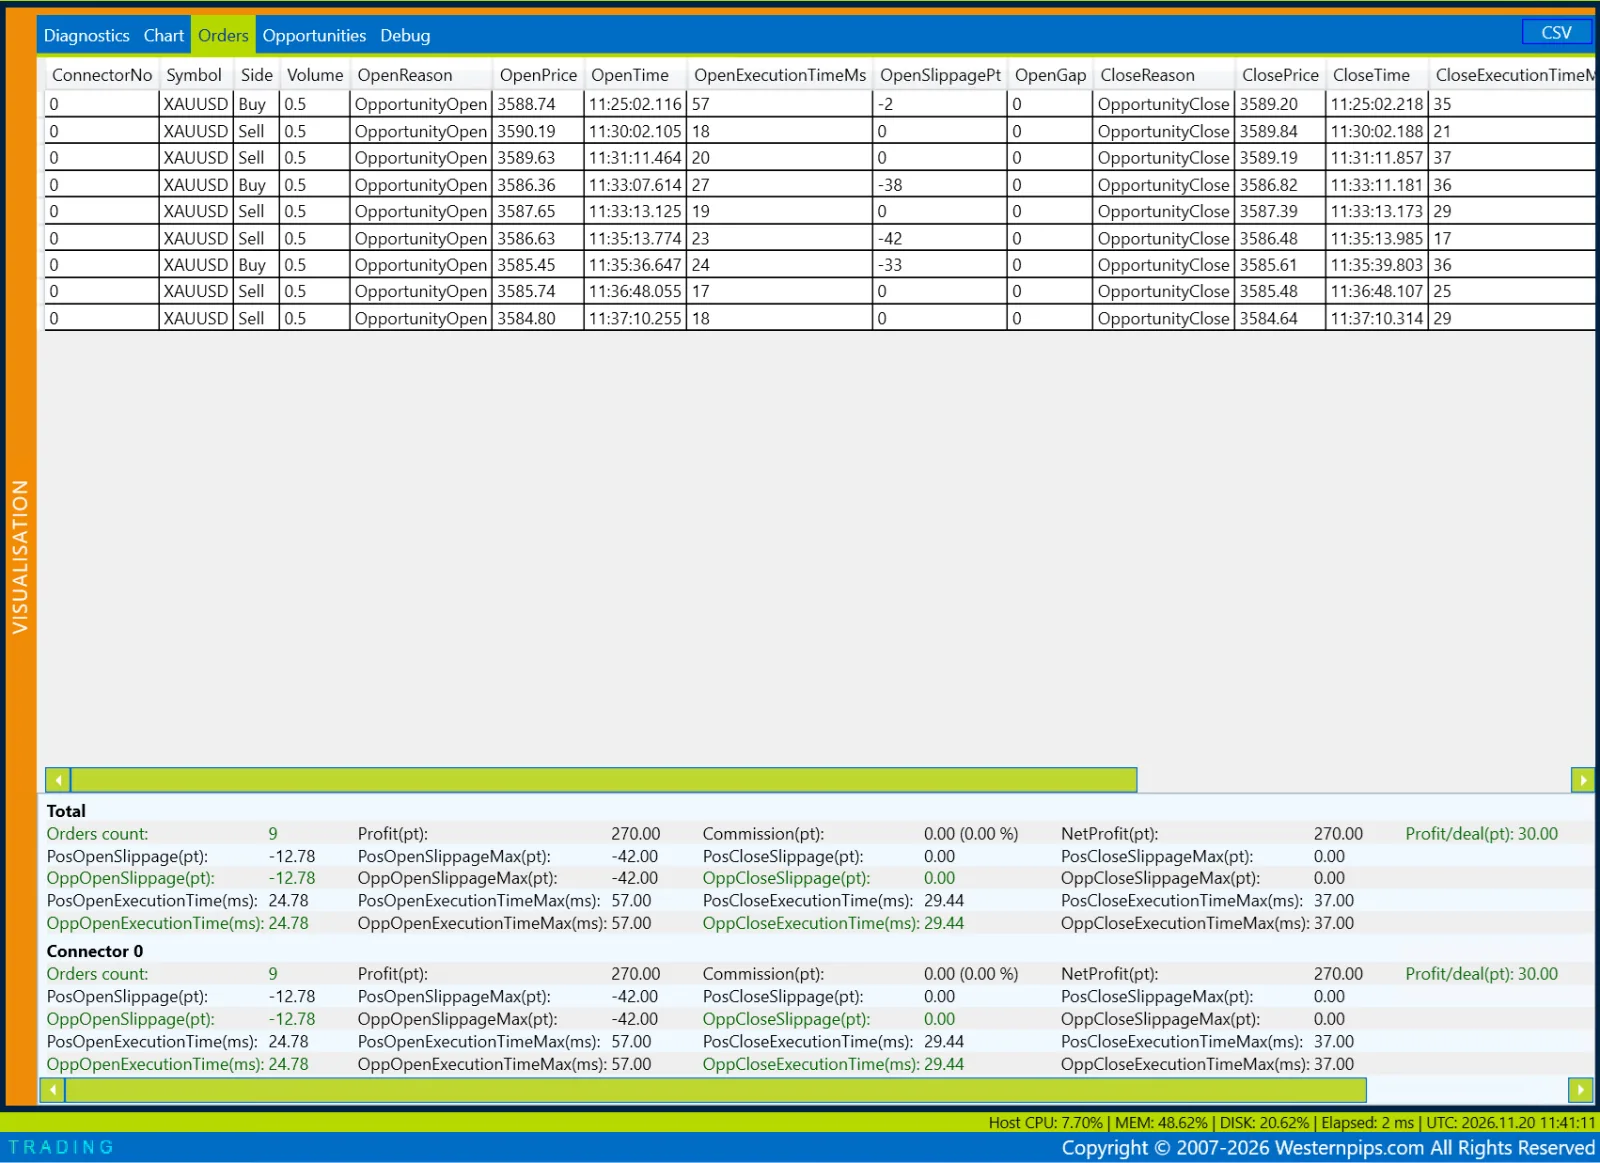

- Every trade reached the take profit. With TakeProfitMode FromEntry the 15-point target is counted from the fill, so the four entries with 33–42 points of slippage still closed in profit.
- Exits had no slippage. All nine closes were filled at the requested price.
- Most profit came from broker jumps. Results of 26–46 points against a 15-point target show the broker often repriced past the take profit in one step.
Long session: the US trading hours
From 14:00 to 17:34 UTC the same set ran through the US session. The Orders tab exported to CSV gives these figures:
| Measure | Value |
|---|---|
| Trades | 1,082 (585 Buy, 497 Sell); no OPEN FAILED, CLOSE FAILED, Emergency or Drawdown lines in the log |
| Result | +26,200 points, 24.2 points per trade |
| Winning trades | 92%: average +33 points; 87 losing trades: average −80 points, largest −162 points |
| Largest drawdown of the points curve | −253 points |
| Entry slippage | 68% of entries at the requested price; the rest on average −25 points (90% within −40); overall average −8.2 points |
| Exit slippage | 99% of exits at the requested price |
| Execution time | median 23 ms on entry and 28 ms on exit |
| Holding time | median 0.09 seconds; 90% of trades closed within 1.9 seconds |
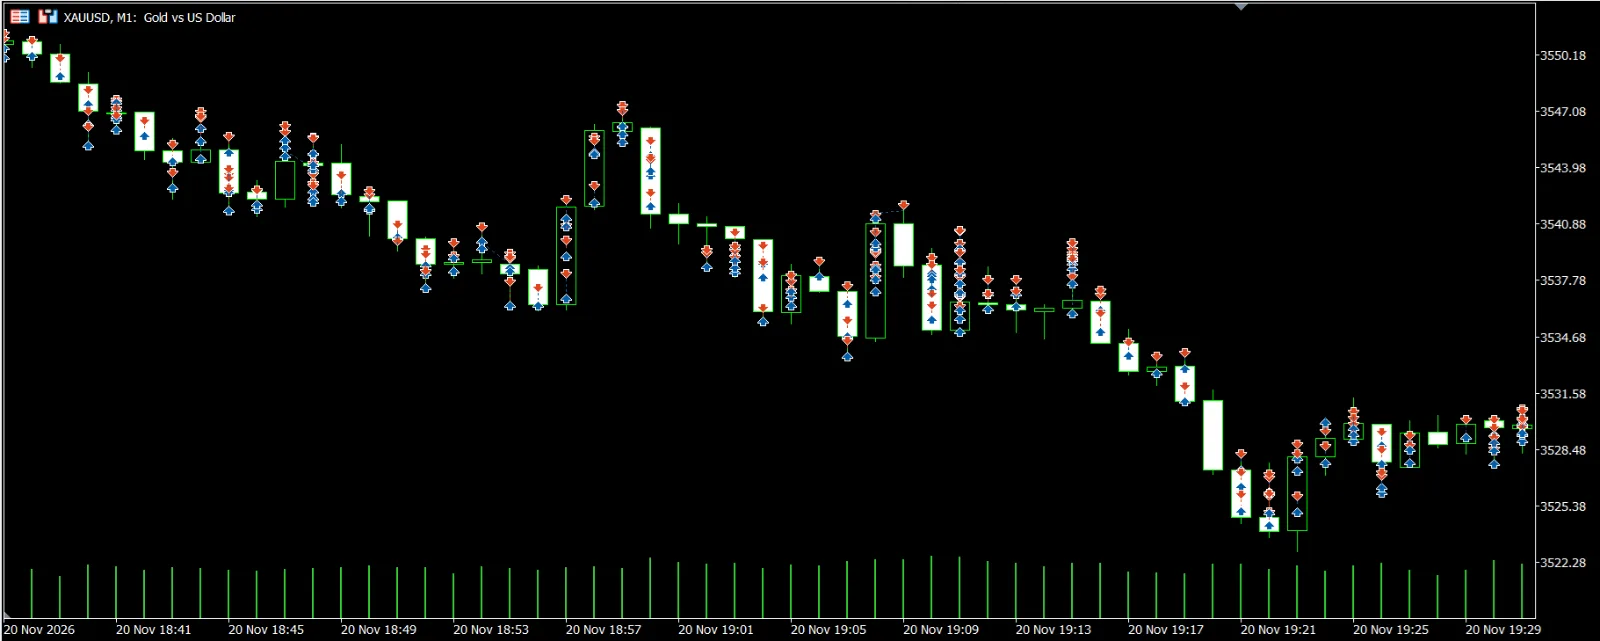
The broker’s account report for the whole day (1,100 trades, all sessions above plus short test runs) shows a net result of +10,196.55 on a 100,000 starting balance, profit factor 4.85, 92% winning trades and a maximum balance drawdown of 0.10%.
What the numbers say about the settings:
- Losses are larger than StopLoss 50. With StopLossMode FromSignal the stop is counted from the signal price, so entry slippage is already a loss, and a broker jump can pass the stop level before the close. Average losses of −80 points are the real cost of a stop.
- The win rate carries the result. One average loss costs about two and a half average wins. A broker with more slippage or more failed peaks can turn the same set negative.
- Very short holding times. Trades closed in about 0.1 seconds are exactly what broker risk teams look for. Check the broker’s rules before trading this way: see brokers that allow arbitrage.
These are the results of one day, one broker account and one set. They show how the strategy and its settings behave, not what to expect in the future.
Backtest of the same quotes compared with live trading
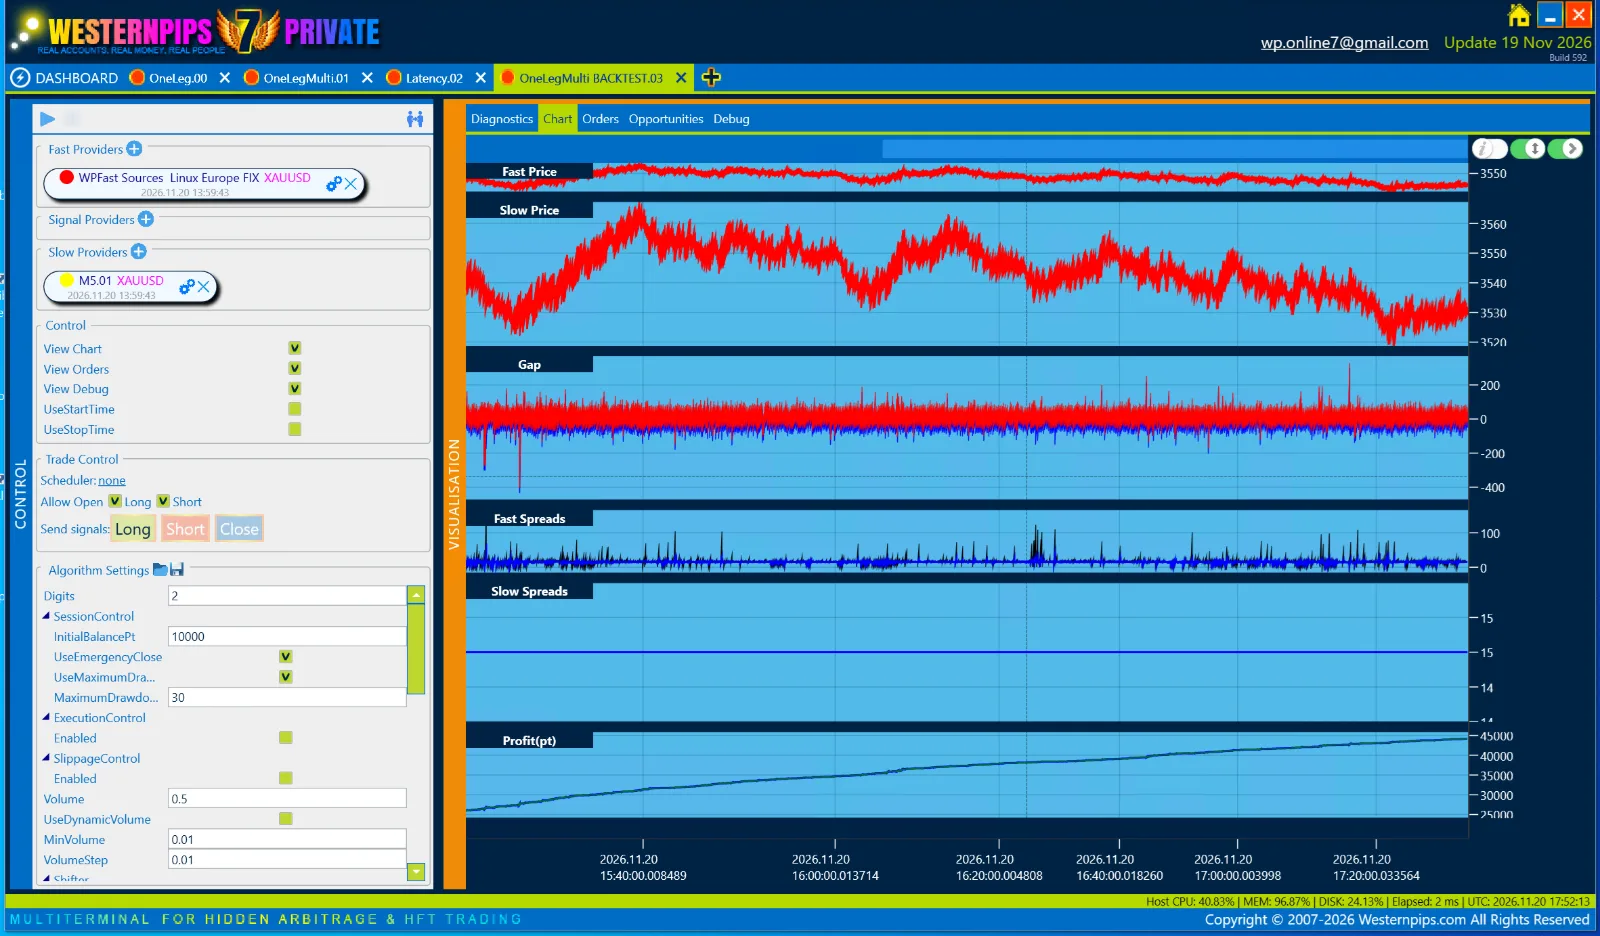
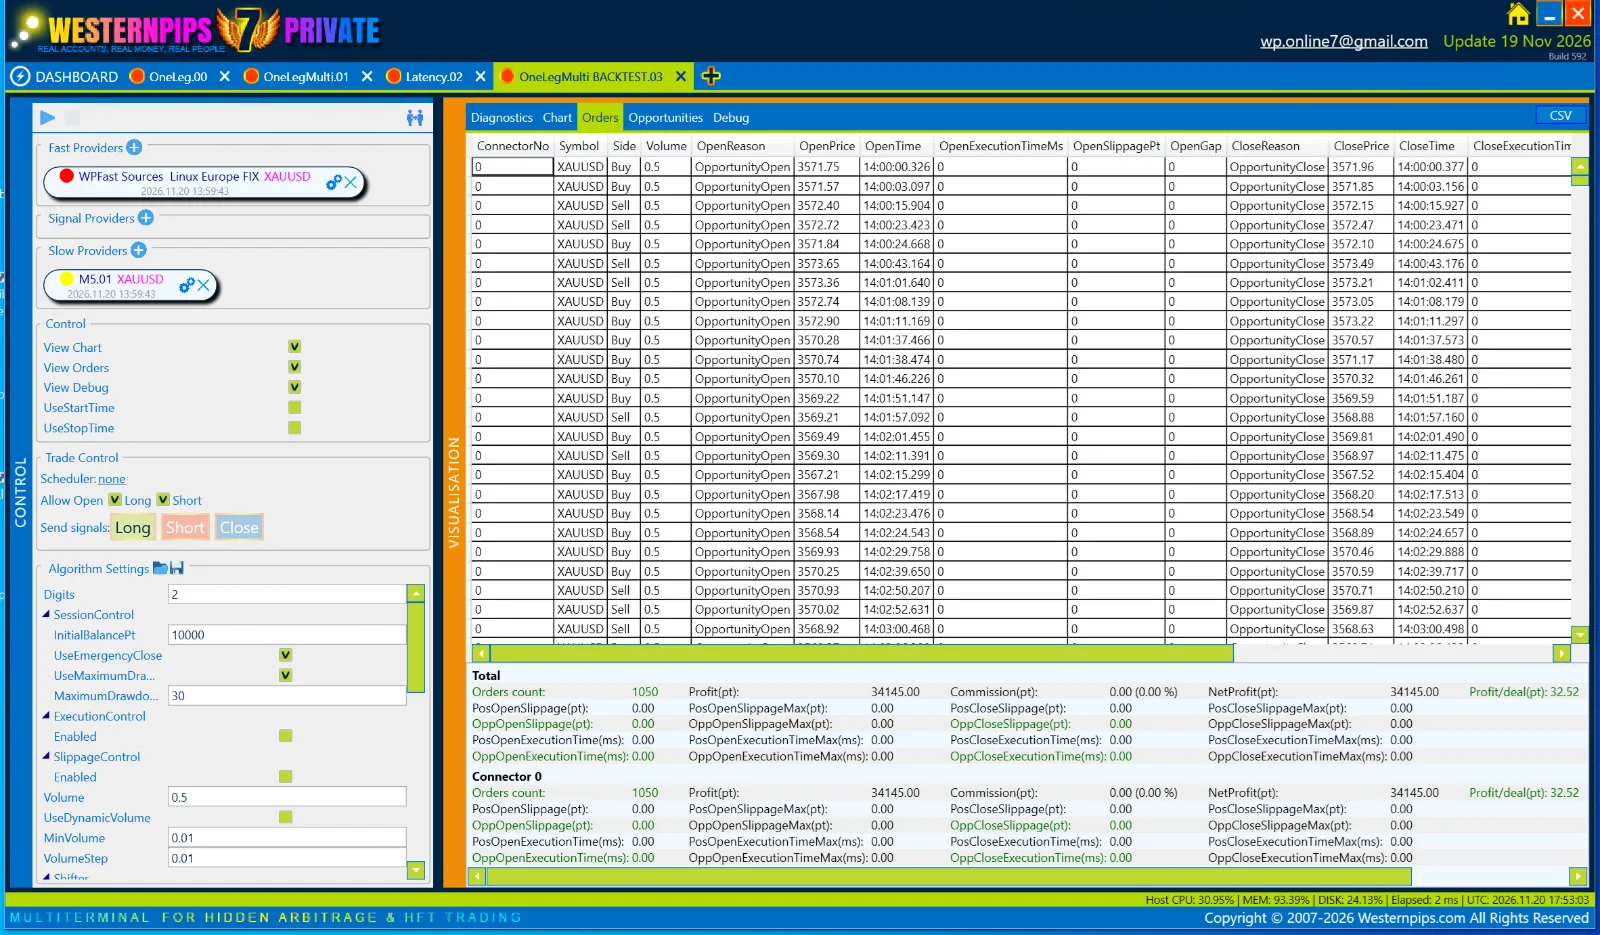
The quotes of the long session were recorded with Save Trace to File and replayed with Backtest OneLegMulti, using the same set but only the XAUUSD FIX feed and no execution delay or slippage on the slow provider.
| Measure | Backtest (no delay, no slippage) | Live trading |
|---|---|---|
| Trades | 1,050 | 1,082 |
| Result | +34,145 points | +26,200 points |
| Per trade | 32.5 points | 24.2 points |
The live result per trade was about a quarter lower, mostly because of entry slippage and the deeper stops it causes. To make a backtest of your own recordings realistic, enter the values measured live in the slow provider of the backtest tab. For this session they would be about: Backtest open execution 25 ms, Backtest close execution 30 ms, Backtest open slippage 50 points with Backtest open zero-slippage 68%, Backtest close zero-slippage 99%. The procedure is in first setup and BackTester.
How to adapt this example to your broker
- Check Digits and the symbols of every provider; for a futures feed keep AutoShift on.
- Record your own quotes and read the Gap chart: Min Open Gap 30 suited a broker with a 15-point spread and these feeds, not every broker.
- Measure slippage and execution with the minimum lot, then test the set in the BackTester with those values.
- Watch the cost of a stop. If average losses are much larger than StopLoss, consider StopLossMode FromEntry, a smaller lot or a higher Min Open Gap.
Related guides
- One Leg Multi settings reference
- One Leg Multi first setup and BackTester
- One Leg Multi troubleshooting
Risk warning. Trading Forex, CFDs and cryptocurrencies with leverage carries a high risk of losing money. Results depend on the broker, its execution and rules, latency and settings; no profit is guaranteed. The set, trades and results on this page illustrate how the settings work on one account and one day; they are not a recommendation or a forecast, and past results do not guarantee future results. Test on a demo account first. Read the full risk warning.