Crypto Table compares verified spreads between exchanges. Use Historical peaks to research a selected day and Live quotes to inspect current opportunities. This page does not place orders.
The main number is After entry fees: the raw spread minus the buy and sell entry taker fees from the exchange catalog. It is not the final profit of a completed trade.
1. Start with the filters
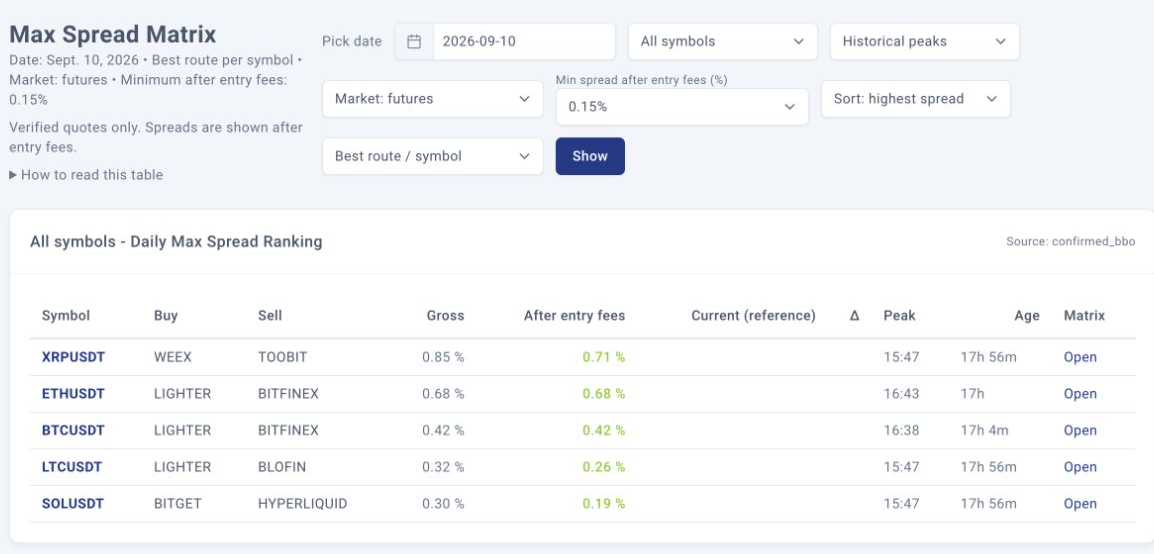
- Open Crypto Table and pick a date (Moscow time).
- Choose All symbols for a ranking, or a specific symbol for its exchange matrix.
- Select Historical peaks or, for today, Live quotes.
- Select the market combination.
- Set Min spread after entry fees (%), for example 0.15%.
- Choose Sort: highest spread and Best route / symbol for an initial overview.
Changing a filter applies it automatically. Expand How to read this table for a short explanation.
2. Verified data only
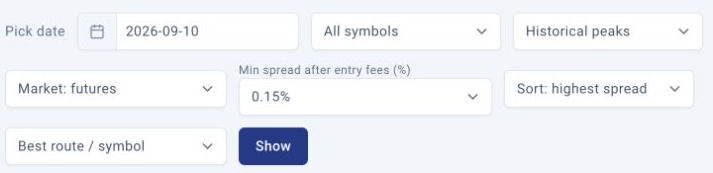
The table no longer has a Confirmed / Unconfirmed selector. Historical results use confirmed observations; Live requires valid, fresh quotes, compatible timestamps and known positive size on both relevant sides. Unknown-size or invalid live quotes are excluded from All routes as well as Best route and the matrix.
Historical confirmation uses multiple distinct observations, not a single price spike. The minimum spread within a confirmation window is retained, then the highest confirmed window value is selected for the day. This does not prove that the spread persisted continuously between observations or that an order would have filled.
Missing verified history stays empty. An empty result does not prove that no opportunity existed that day. Repeated BBO verified labels have been removed from cells because quality checking is now implicit.
3. Historical peaks and Live quotes
Historical peaks shows the highest confirmed spread for the selected Moscow day. In a matrix cell, the small time below the spread is the peak time. In the ranking, Current (reference) is a separate current value, and Δ is current spread minus historical peak spread. Neither replaces the historical result.
Live quotes shows current spreads. Age is quote age, Skew is the time difference between the legs, and Size is the displayed available BBO size, not guaranteed executable depth for an arbitrary order.
Live is available only for today. Selecting a past date uses Historical mode. Today refreshes approximately every 30 seconds in Historical mode and every 3 seconds in Live mode. Past dates do not auto-refresh; later source-history backfills can still change historical results when reloaded.
4. Markets
- futures: futures against futures.
- spot: spot against spot.
- spot-futures: both BUY spot / SELL futures and BUY futures / SELL spot, including different markets on the same exchange.
- all: combines spot-spot, futures-futures and spot-futures routes.
Mixed-market venues include the market in their identity, such as binance:spot and binance:futures. The detail link preserves each leg’s market. Coverage depends on the quotes and verified history actually collected. A SELL spot leg requires an asset balance or borrowing where supported.
5. Minimum spread in percent
Min spread after entry fees (%) offers 0%, 0.10%, 0.15% and 0.25%. The default is 0.15%. It filters the main spread in both the All symbols ranking and the single-symbol matrix. Values below the minimum are hidden; values equal to it are eligible. Other quality checks still apply.
0.15% equals 15 basis points. Existing URLs may still contain min_net_bps=15; the interface displays the equivalent percentage.
In Historical mode the filter applies to the historical spread. Current (reference) can be lower because it answers a different question: what is visible now? Selecting 0% does not disable quality checks or include negative main spreads.
Filtering uses the underlying value before display rounding. A number near the boundary may round to the selected threshold.
6. Ranking and sorting
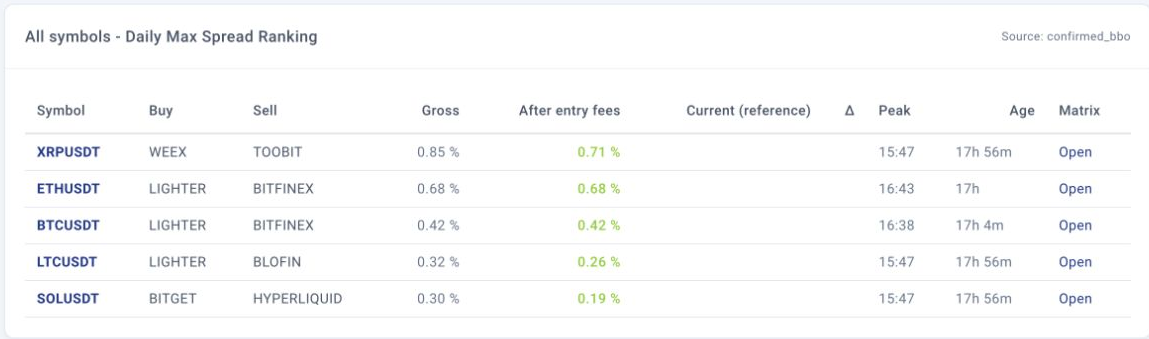
Best route / symbol chooses one preferred route per symbol. All routes displays qualifying exchange pairs within the row limit. The existing outlier preference can favor an unflagged route over a flagged route when choosing the best route.
Sort: highest spread orders ranking rows by spread after entry fees. In the matrix it orders BUY rows and SELL columns by their strongest spreads. Sort: alphabetical orders symbols or exchange names.
Ranking columns:
- Symbol, Buy, Sell: instrument and direction.
- Gross: spread before fees.
- After entry fees: the main spread used by the minimum filter.
- Current (reference) and Δ: current comparison in Historical mode.
- Peak and Age: historical peak time and age; Live uses quote age.
- Skew and Size: additional Live quote information.
- Matrix / Open: open that symbol’s matrix.
The strategy selector and Strategy cycle, Threshold and Entry status columns are no longer part of this analyst page. The displayed fees are catalog entry fees, not the costs of a selected trading robot.
7. Read the matrix and open a chart
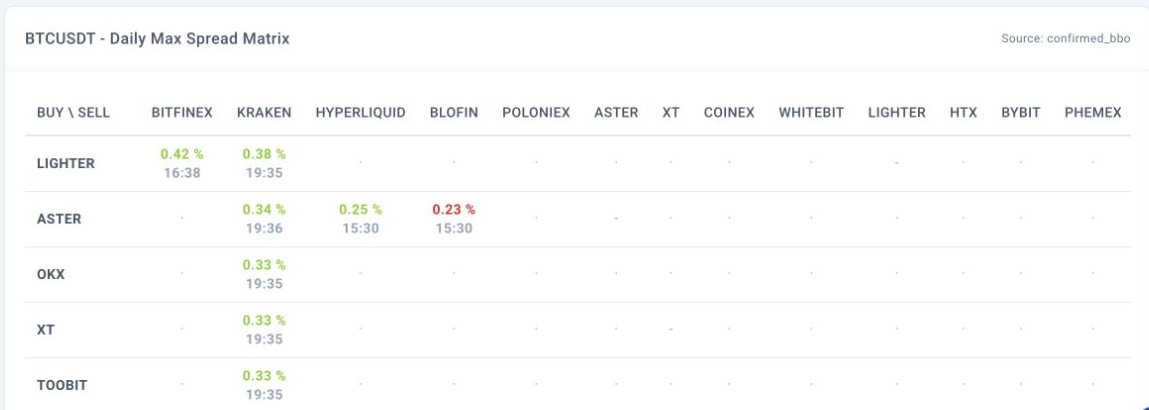
The screenshot shows the visible portion of the matrix; scroll horizontally for more venues.
Rows are BUY, columns are SELL. Read a cell as buying on the row venue and selling on the column venue.
The main value is after entry fees. Historical cells show peak time underneath; Live cells show quote age. Hover for gross spread, fees, prices and available timing details. Click the value to open the route chart at its historical peak.
A dash marks the same venue against itself. An empty cell can mean missing verified data, an invalid current quote, or a spread below the selected minimum. Hover for the applicable explanation. Different markets on the same exchange are distinct venues.
8. Colors and small values
Green normally starts at 0.15% after entry fees. Smaller positive values can be grey when a lower minimum is selected. Lowering the filter does not change the color threshold.
Muted red means Venue outlier, not a negative spread. A separate heuristic flags routes when many peak times cluster around one exchange. This flag can coexist with verified quote quality and is not proof of bad data. For example, a positive 0.23% can be red. Check the tooltip and route chart before interpreting it. The flag currently affects both color and best-route preference.
Very small values may use basis points: 1 bp = 0.01%. The minimum selector always uses percentages.
9. Costs and limitations
The displayed spread deducts the two catalog entry taker fees. It excludes exit fees, funding, spot borrowing costs, slippage and strategy-specific buffers. Separate market-specific fee treatment is not implied by choosing spot-futures.
A historical peak is not a current entry signal. Verified quotes do not guarantee execution, sufficient depth for your size, or realized profit. Reference venues marked ref should not be mistaken for executable exchange legs.
10. Practical workflow
- Choose a date, All symbols, Historical peaks and the required market combination.
- Start with a minimum of 0.15% and Sort: highest spread.
- Open a candidate’s matrix, confirm BUY/SELL direction and inspect the peak chart.
- For today’s opportunities, switch to Live quotes and inspect age, skew and size.
- If results are empty, check the date, market and minimum. Lowering the minimum reveals smaller verified spreads; it does not restore missing history or bypass quality checks.